
Coverage Watch does not have a financial relationship with any car insurance companies and quote providers. Everything displayed on the site is completely free from bias and based on legitimate data.
Get Cheap Car Insurance in Norfolk County, MA
We monitor insurance prices, helping the average driver in Norfolk County save up to 35.5% on car insurance.
The Cheapest Minimum Coverage in Norfolk County
The chart below shows the cheapest car insurance company in Norfolk County for a driver with a good record seeking minimum coverage on a mid-grade used vehicle. Values are estimated, and premiums may be lower or higher, but should be in an accurate order for a good driver. In general, drivers with good records will get the best prices through Safety Insurance, followed by Geico, Midvale Home & Auto, and Travelers.
| Norfolk County Insurer | Monthly Cost |
|---|---|
| Safety Insurance | $44 |
| Geico | $47 |
| Midvale Home & Auto | $55 |
| Travelers | $70 |
Savings for Every Kind of Norfolk County Driver
Based on our extensive insurance data, we know the average Norfolk County driver will save about 34% on car insurance. This isn’t marketing: this is unbiased data with no financial influence. The best auto insurance company depends on factors such as your driving record, home location, and age. The average driver will find themselves saving $598 per year by choosing the right vehicle insurance company. Some Norfolk County residents are paying out over $1,749 extra every year for auto insurance in Norfolk County. That cost may be even higher if you haven’t requested a new quote as your life situation changed.
Situation |
Norfolk County, MA Savings / Yr. |
|---|---|
$598 |
|
$890 |
|
$740 |
|
$982 |
|
$2,165 |
|
$0 |
|
$0 |
Norfolk County Car Insurance vs. Massachusetts
People living in Norfolk County pay an average of 12.61% more than the typical driver in the state. The average driver in Norfolk County can expect to pay about $751 per year, or $1,749 for full coverage.
Based on our analysis, State Farm will be the cheapest provider in Norfolk County for most people.
Car Insurance Prices by Norfolk County Neighborhood
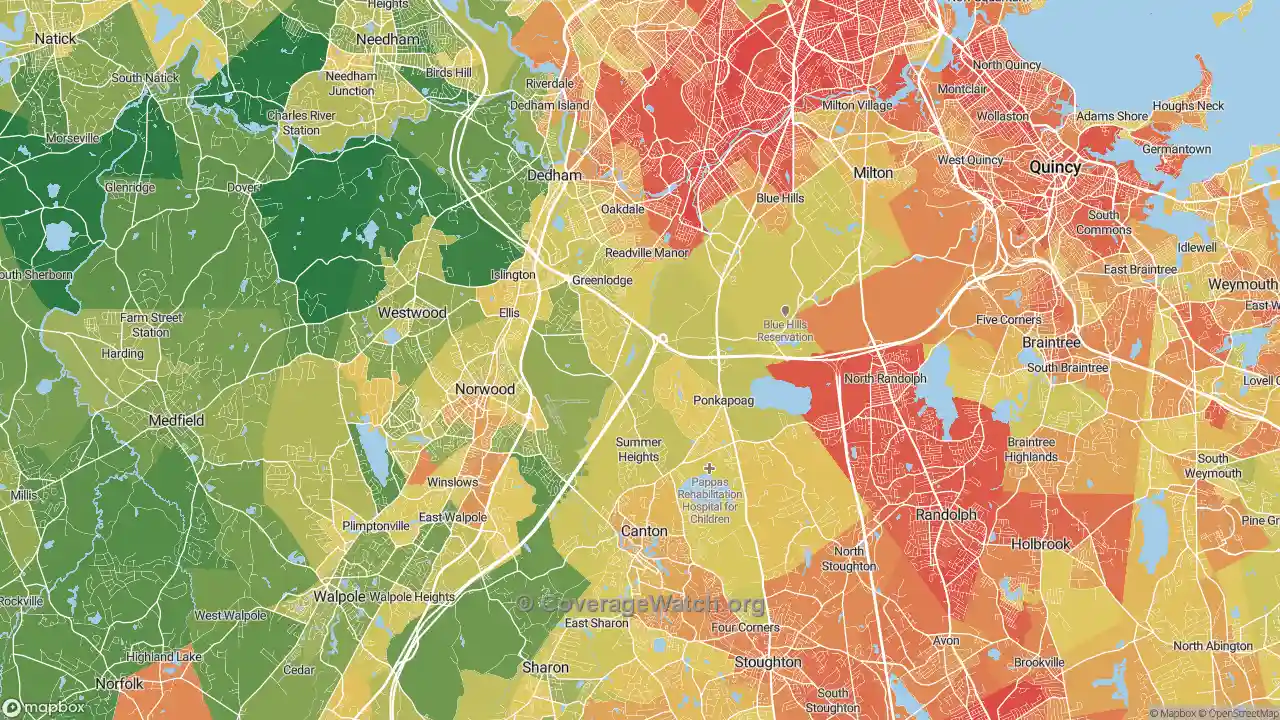
Insurance Prices
Where is insurance cheapest within Norfolk County?
The map shows insurance prices in and around Norfolk County, with more expensive areas in red and places with cheaper car insurance in green. Insurance can vary by as much as $829 per year within the county boundaries, with insurance premiums ranging from a high of $2,307 to a low of $1,478. Insurance prices tend to be higher for those living in the Northeast area, and lower for those with homes in the Southwest parts of Norfolk County.Pick the Best Car Insurance Company for You in Norfolk County
The best car insurance provider for most drivers in Norfolk County

For drivers with clean driving records and no major strikes, State Farm is the best option, with annual savings of $598 over the average Norfolk County car insurance company.
The best car insurance provider for Norfolk County drivers with accidents on their records
In our analysis, State Farm saved the average person who had been in an accident the most, with annual savings averaging $890 over the competition.
The best car insurance company for Norfolk County drivers with speeding tickets
>State Farm gave the average person with a speeding ticket the most savings, averaging $740 better than other car insurance companies.
The best auto insurance for Norfolk County drivers with a DUI conviction
Getting a quote from State Farm may cost the average person with a DUI about $982 less each year.
The least expensive car insurance company for new and young drivers in Norfolk County
In Norfolk County, State Farm costs young drivers $2,165 less each year versus the average auto insurance bill.
The best marriage discounts for vehicle insurance in Norfolk County
The cheapest car insurance in Norfolk County for drivers with bad credit
The best Norfolk County car insurance company for customer service

Nationwide was the best company for customer service in Norfolk County according to the NAIC.
Recent price drops
In 2020, at the peak of the global pandemic, {{top1_2020pricedrop_company}} changed their average price {{top1_2020pricedrop_company_percentage}}% in Norfolk County, which was better than other insurers.
The cheapest large national provider in Norfolk County
For customers who prefer to work with large national providers, we recommend State Farm for pricing. The average Norfolk County driver can expect to pay about $85 per month.
What About USAA?
JD power consistently ranks USAA as the top car insurance company in the United States. We don’t compare their rates because most people can’t sign up. USAA only allows active military members and their spouses and children to apply. In Norfolk County, USAA has the best prices for drivers with speeding tickets, drivers with a DUI conviction, good drivers, young drivers, and drivers with accidents.Auto Insurance Prices in and Around Norfolk County
What Influences the Cost of Car Insurance in Norfolk County?
On average, car insurance in Norfolk County is more expensive than the rest of the state. These high prices are no mystery to us. Coverage Watch tracks car insurance costs and uses a complex AI that finds related variables, and has determined car insurance prices in the county are influenced by the following factors:
- The average commute time in Norfolk County is 43 minutes, which is far more than average for a driver in the state.
- Massachusetts state insurance regulations may allow for lower prices.
- An average of 0 weeks with snow on the ground, which impacts accident rates.
- Vehicle theft rates in the area are moderate, with a Vehicle Theft Crime Grade of A- according to CrimeGrade.org.
- Norfolk County is a lightly populated area in the state. The county’s density could result in a price decrease for drivers.
As a result of these and other factors, the average cost of car insurance in Norfolk County is $63 per month for minimum coverage and $146 per month for full coverage. Costs vary widely based on your situation, and will likely be lower if you have a clean driving record and follow our insurance company research to find the best car insurance company for you.
Car Insurance in Nearby Counties
- Suffolk County: Insurance costs 18.01% more
- Worcester County: Insurance costs 8.00% less
- Hampshire County: Insurance costs 11.89% less
- Hampden County: Insurance costs 4.75% less
- Columbia County: Insurance costs 28.02% more
- Greene County: Insurance costs 30.59% more
- Delaware County: Insurance costs 25.84% more
- Broome County: Insurance costs 27.79% more
- Tioga County: Insurance costs 19.55% more
- Chemung County: Insurance costs 23.10% more
Counties with Similar Populations
- Bernalillo County: Insurance costs 5.26% less
- Multnomah County: Insurance costs 2.80% more
- San Mateo County: Insurance costs 19.44% more
- Jefferson County: Insurance costs 27.73% more
- Jefferson County: Insurance costs 3.20% less
- Jackson County: Insurance costs 11.44% more
- Hudson County: Insurance costs 36.88% more
- Fort Bend County: Insurance costs 7.32% more
- Essex County: Insurance costs 0.11% more
- El Paso County: Insurance costs 10.35% more